| A=0 | A=1 | A=2 |
|---|
 | 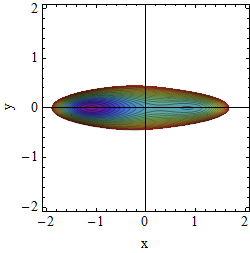 | 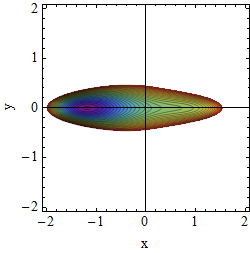 |
| Figure 1. Equipotential surfaces (up to energy E=2.5). | 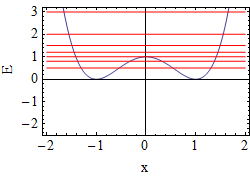 |  | 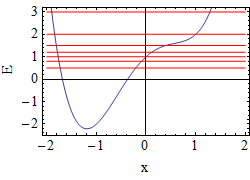 |
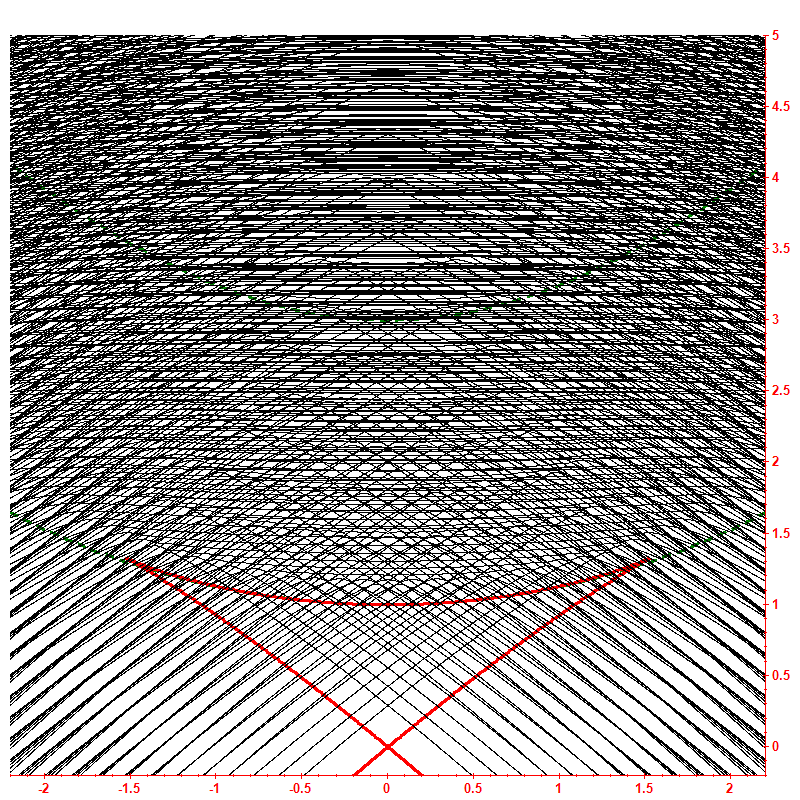
| Figure 2. Section y=0 of the potential. The red lines indicate energies of the Poincaré sections in Figure 4. | 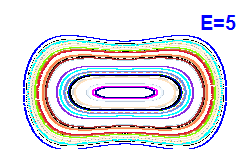 | 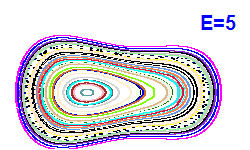 | 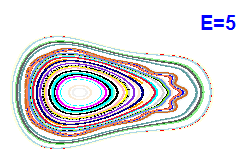 |
 |  |  |
 |  |  |
 |  |  |
 |  |  |
 |  |  |
 |  |  |
 |  |  |
 | 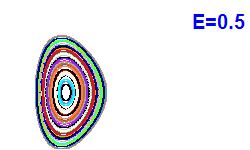 |  |
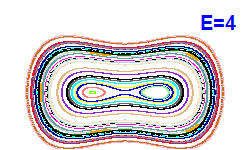
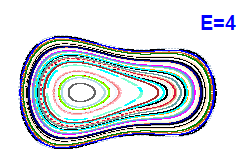
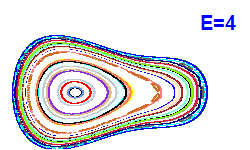
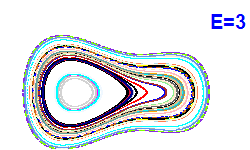
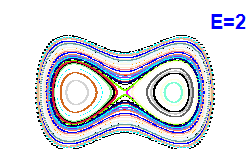
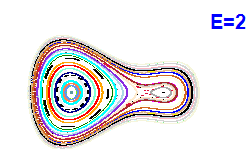
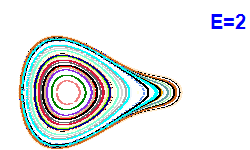
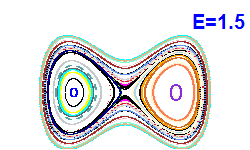
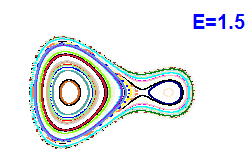
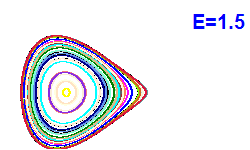
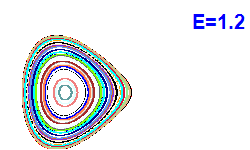
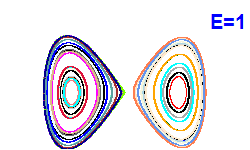
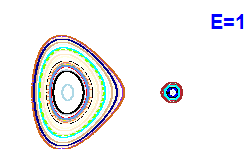
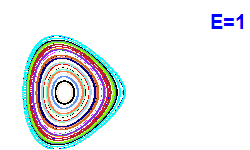
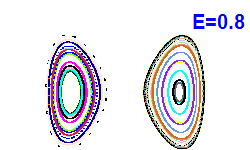
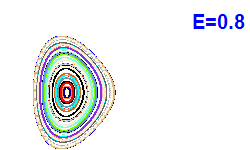
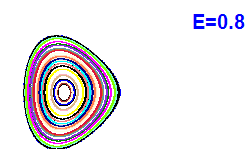
| Figure 4. Poincaré sections (x, px; y=0). |
|
 |
| Figure 5. Frequencies of the harmonic oscillations in the minima (the blue and the red line correspond to the left and the right minimum, respectively; the solid and the dashed line
correspond to the x and y direction, respectively).
Green thick lines show the ratio of the frequencies y:x (the rigidity ratio) in both minima. |
| hbar=0.05 |
|---|
 |  | Figure 6. (A; E) Level dynamics.
The intensity of the red color shades expresses the classical chaoticity (see Figure 3, if present).
Green dashed lines separate regions of a fully convex border of the kinematically accessible region from a partly concave one.
Red solid lines correspond with the positions of the stationary points of the potential (critical triangle).
Click on the Figure to see the smoothed level dynamics (oscillating part of the level density). | Figure 7. (x; E) Peres lattice for x=<x> (horizontal axis) and E=<H> (vertical axis).
Green dashed lines separate regions of a fully convex border of the kinematically accessible region from a partly concave one.
Red solid line shows the potential shape V(x, y=0).
Blue solid line gives the classical measure of regularity freg(E) on the horizontal axis. |
|


 Please wait...
