|
|
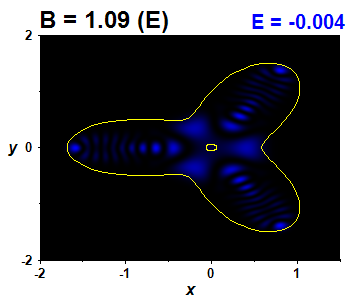
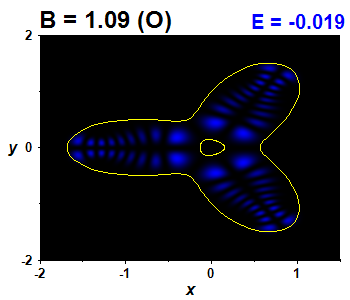
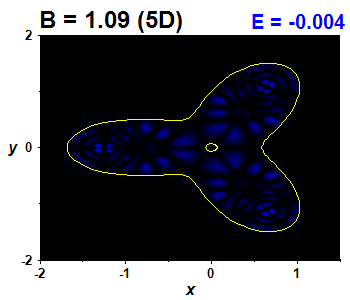
Comparison of different quantization schemes |
|
150 lowest energy levels for equal values of parameters.
Section ?=0 of the potential energy surface is drawed by the yellow curve.
The blue thick line indicates the selected level, for which the density of the wave function is drawed bellow.
The orange thick line corresponds with the energy above that the chaotic dynamics appears.
The red curves show the lowest energy states in the harmonic approximation of the bottom of the potential.
|
|


 Please wait...
