|
|
 |
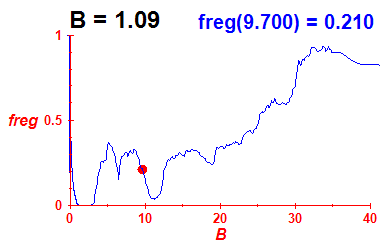 |
| Figure 1: freg (B=1.09, E) |
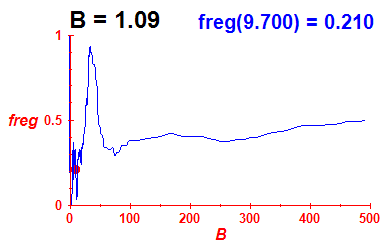
The same as in Figure 1, but in different scale. |
| Calculated using the sections of regularity (see Figure 2). |
|
 |
 |
| The same as in Figure 1, but in different scale. |
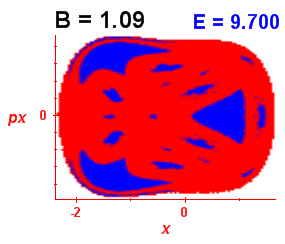
Figure 2: Section of regularity |
| |
Poincaré section y=0 calculated on a 100 x 100 grid. A trajectory is started at each point of the grid and the SALI method is used to distinguish regular (blue colour) from chaotic (red colour) trajectories. |
|


 Please wait...
