 | Figure 1. (A; E) Level dynamics.
The intensity of the red color shades expresses the classical chaoticity (see Figure 3, if present).
Green dashed lines separate regions of a fully convex border of the kinematically accessible region from a partly concave one.
Red solid lines correspond with the positions of the stationary points of the potential (critical triangle).
Click on the Figure to return to the dynamics summary. | |  | Figure 3. (A; E) Classical regularity freg (white-regular: freg=1, black-chaotic: freg=0).
Green dashed lines separate regions of a fully convex border of the kinematically accessible region from a partly concave one.
Red solid lines correspond with the positions of the stationary points of the potential (critical triangle). |
|
| ρ | dρ/dE | ρ-bar(ρ) | | ρ | dρ/dE | ρ-bar(ρ) | 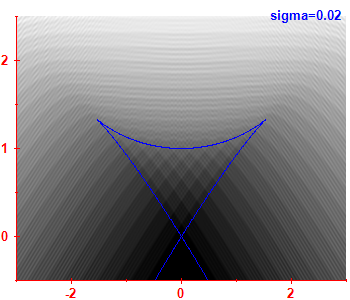 | 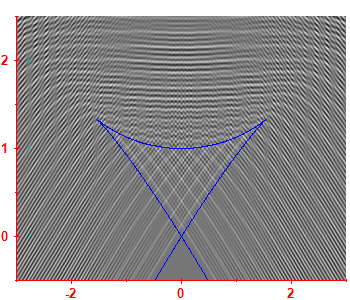 |  | | 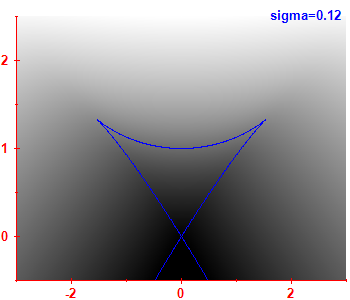 | 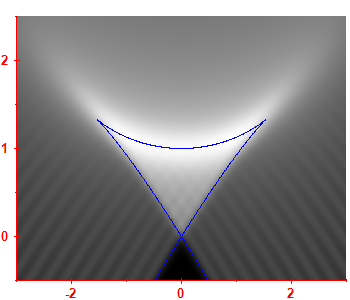 | 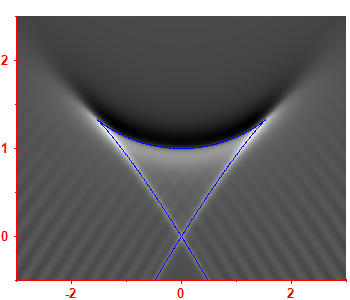 |
 |  |  | |  |  |  |
 |  |  | |  |  |  |
 |  |  | |  |  |  |
 | 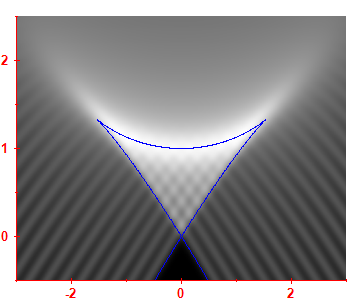 |  | | 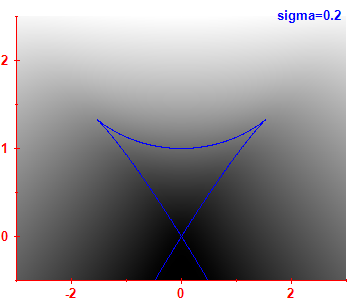 | 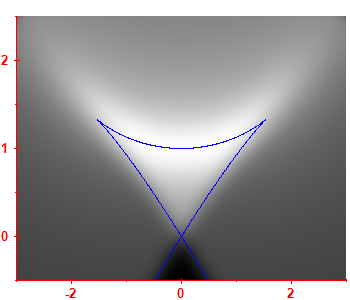 | 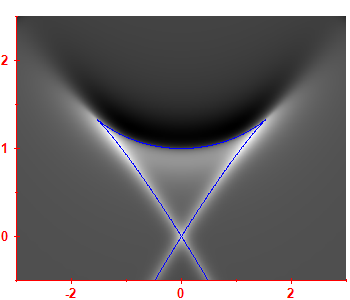 |
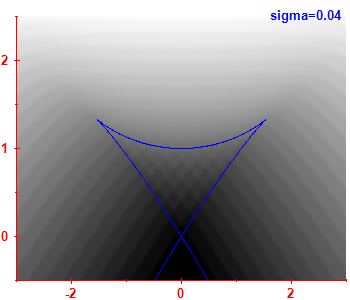
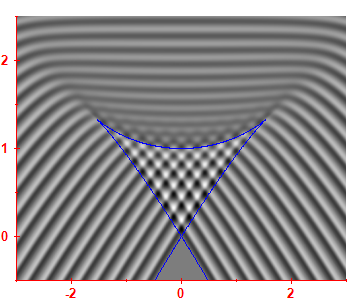
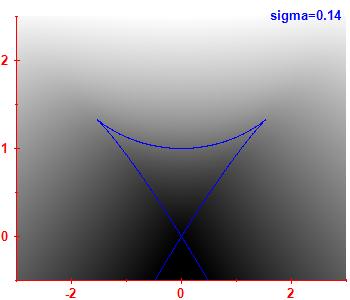
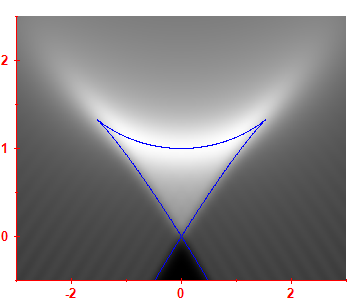
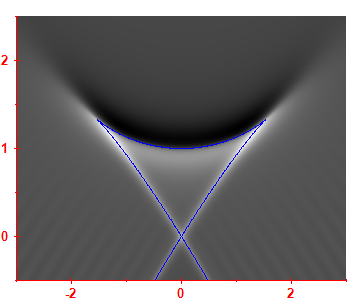
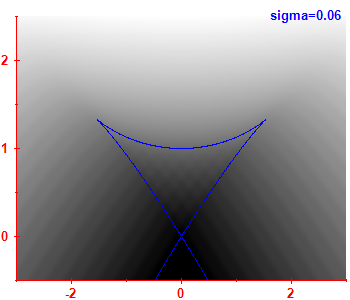
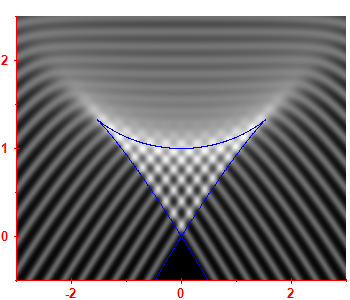
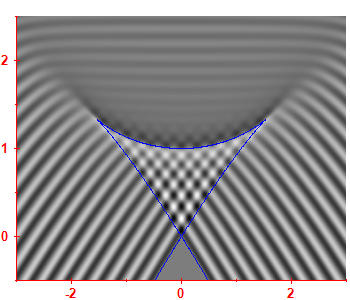
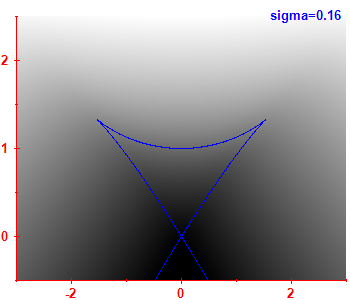
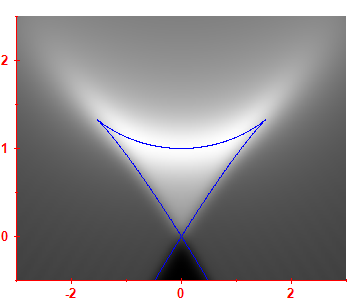
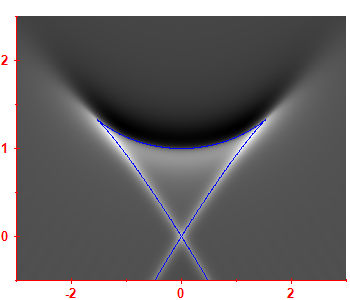
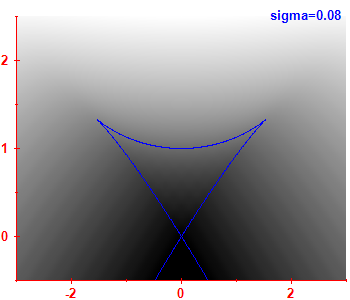
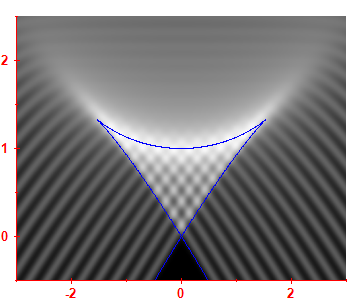
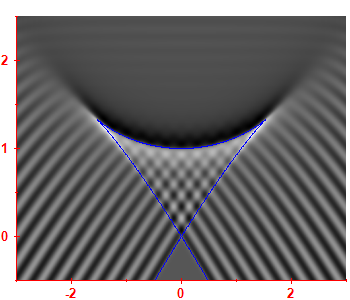
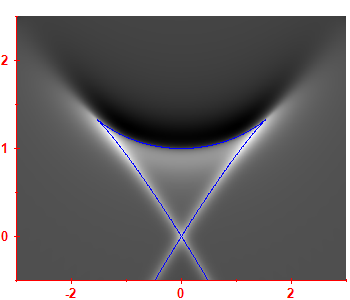
Figure 2. Smoothed level density  for various values of σ. for various values of σ. |
|


