


|
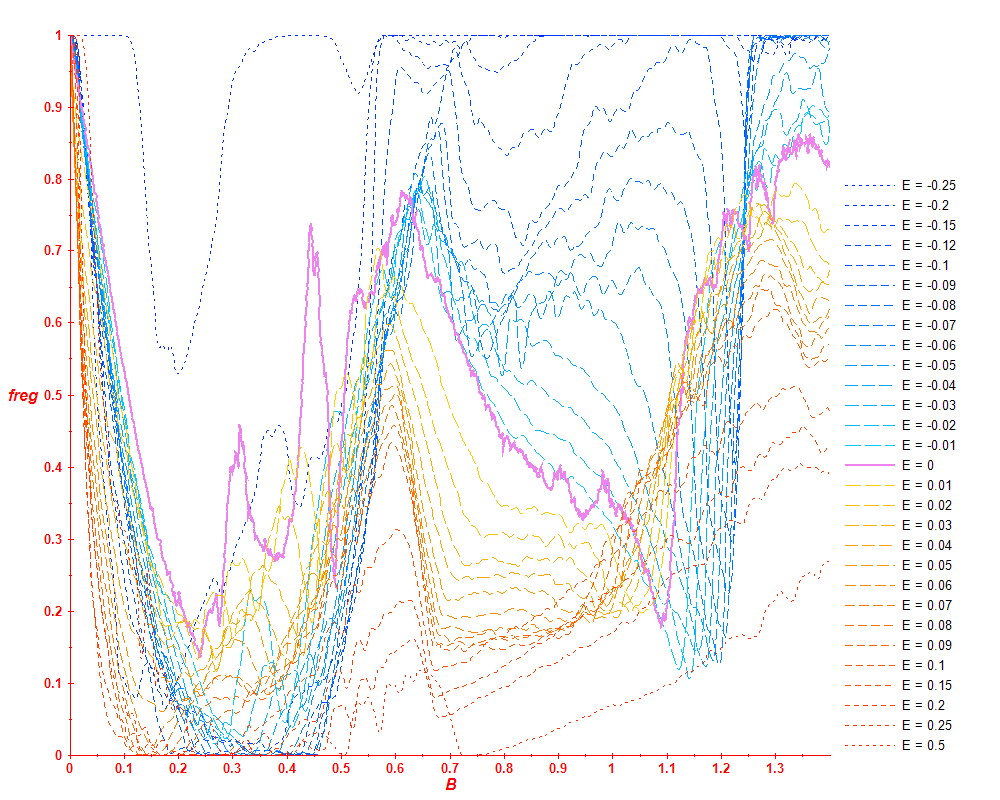
| Figure 1: freg(B) for energies around E=0. Positive (negative) energies are plotted by reddish (blueish) curves. Zero energy E=0 is indicated by a thick violet curve. At this energy, well-pronounced maxima of the regularity are observed for B=0.31 and B=0.45. These maxima disapear when moved to nonzero energies (except the extremal case of very small energies in the region of the validity of the quadratic integrable approximation). |

|
| Figure 2: freg(B) for energies E≤0. |
|
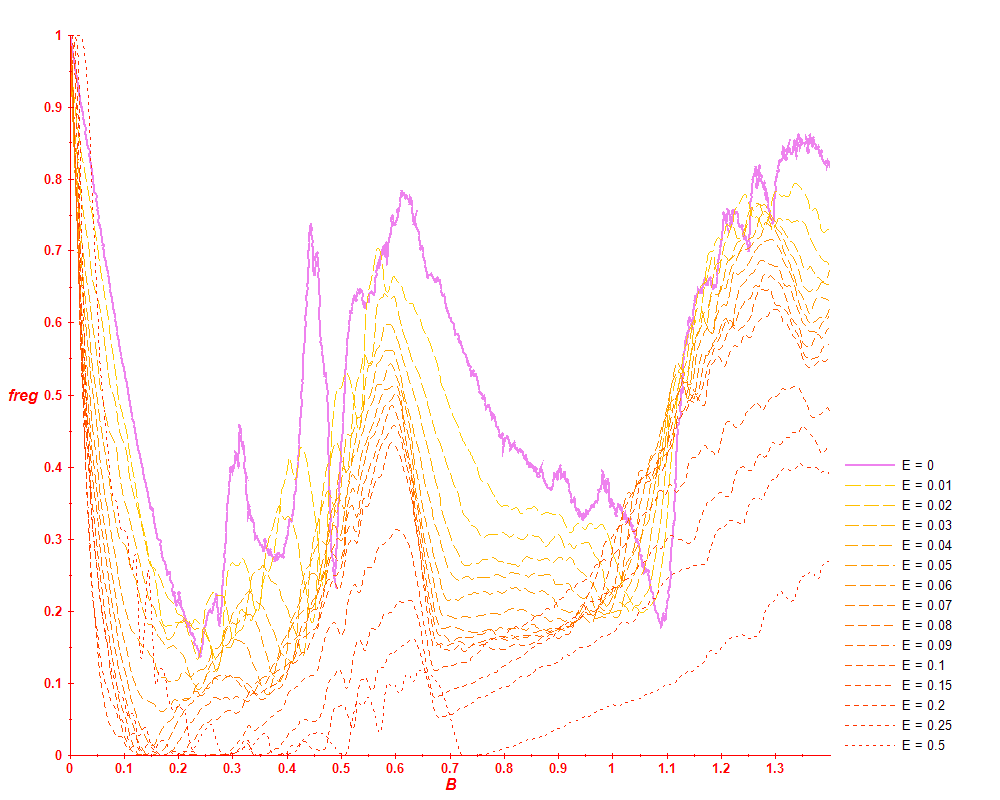
| Figure 3: freg(B) for energies E≥0. |
 Please wait...
