

 |
 |
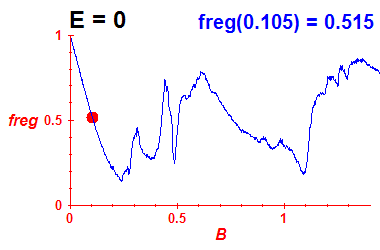
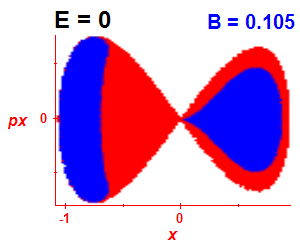
| Figure 1: freg (B, E=0) | Figure 2: Section of regularity |
|---|---|
| Calculated using the sections of regularity (see Figure 2). | Poincaré section y = 0 calculated on the 100 x 100 grid. A trajectory is started at each point of the grid and the SALI method is used to distinguish regular (blue colour) from chaotic (red colour) trajectories. |
 |
 |
| Figure 3: Peres lattice of the operator L^2 | Figure 4: Classical Peres invariant |
| 3000 lowest lying well-converging states are displayed. The grey line corresponds with the energy E=0, on which the section of regularity (Figure 2) and the Peres invariant (Figure 4) are calculated. | Time averaged value of the variable L^2, calculated on the 400 x 400 grid. |