 |
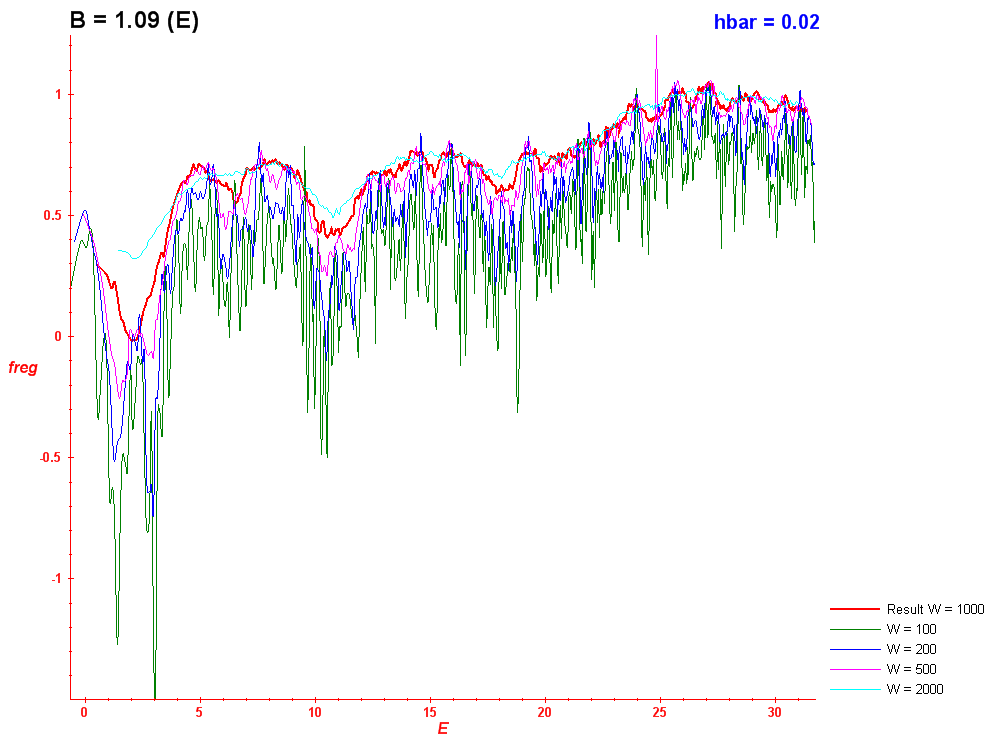
| Figure 1: Dispersion of adjunct of the Brody parameter 1-ω |
|---|
|
Thick red line corresponds with the mean value of the result.
Grey lines indicate the beginning and the end of the interval used for the calculation of one ω
(the interval contains 1000 energy levels).
Blue lines show the dispersion of the fit at each point.
|
 |
| Figure 2: Dependence on the number of levels used for the calculation of one ω |
|---|
|
The number of levels is given in the legend.
The larger the interval, the smoother the curve and the less details.
On large intervals grows the systematic error due to including levels from regions of highly distinct dynamics.
The final calculation was done with W=1000.
|
 |
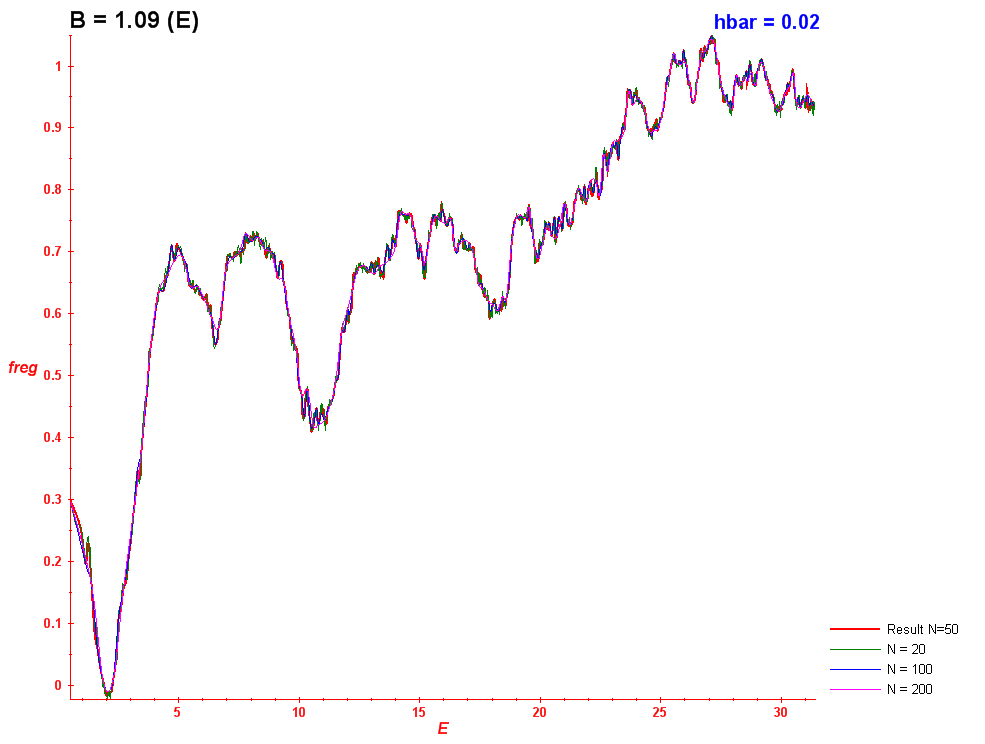
| Figure 3: Dependence on the number of points of the final curve |
|---|
|
N corresponds with the number of energy levels between each point of the curve.
The larger the further the points are from one another.
Since the final calculation includes W energy levels for each point (see Figure 2),
it means that for N<W the levels are used for the calculation of several points of the final curve.
The final calculation was done with N=50 (hence each level is included in the calculation of 20 successive points).
|


